NPS Photo / Laura Phillips
Introduction
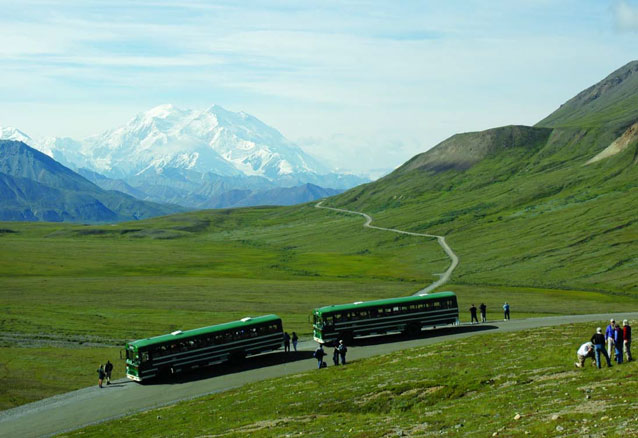
The 90-mile Denali Park Road, built to access Mount McKinley National Park and the Kantishna mining district, received relatively little use from 1938 until 1971. Use of the road tripled between 1971 and 1972 with completion of State Hwy 3 between Fairbanks and Anchorage. Due to this increase, park managers restricted use of private vehicles along the road beyond the Savage River and implemented a visitor transportation system (VTS) to protect park resources. The VTS relies on a bus fleet to transport visitors along the park road (Figure 1). In 1986, Denali’s General Management Plan established an annual limit of 10,512 vehicle trips beyond the Savage River. While that limit has not yet been reached, park visitation increases annually and park managers anticipate requests to increase the current annual limit.
We developed a multidisciplinary project to determine the capacity of the Denali Park Road. Components of our study include examining movements of Dall sheep and grizzly bears in relation to traffic and habitat using Global Positioning System (GPS) technology, modeling patterns of vehicle movement using on-board GPS receivers, and implementing visitor surveys to identify factors affecting visitor experiences. Park managers will rely on models developed from study results to determine whether the road is currently over-capacity, at-capacity, or under-capacity.
This article summarizes the study design and methods established in 2006 to begin integrating various components of the road capacity study and collecting data.
2006 Objectives
- Develop an integrated research design and build partnerships with cooperators to begin data collection.
- Deploy GPS units on 100 VTS and tour buses and 50 National Park Service vehicles using the park road.
- Conduct 120 qualitative visitor experience surveys.
- Capture and fit 20 grizzly bears within the road corridor with GPS collars.
- Develop methods to ground truth GPS data using driving surveys and traffic counters.
Methods
Wildlife movements will be examined to determine the effects of traffic on use of habitats adjacent to the park road or restrictions to migratory movements. GPS data from 20 grizzly bears was downloaded and plotted in ArcGIS (Figure 2, below).
Summer 2006 Bear Tracking
Check out the movements of three bears tracked as part of the Denali Park Road study. The denser the points, the more time the bears spent in that part of the park.
Cooperators asked 120 visitors a series of qualitative questions pertaining to their experience on the Denali Park Road to identify indicators of a quality park experi-ence. These indicators will later be used to build a quantitative assessment tool to create social standards for visitor experience.
Examples of survey questions asked include:
- How does the number of vehicles on the Denali Park Road affect your enjoyment of visiting the park?
- Have you seen visitors or vehicles on the Denali Park Road disrupt the natural behavior of wildlife?
- If you could make changes to the Denali Park Road,what would they be?
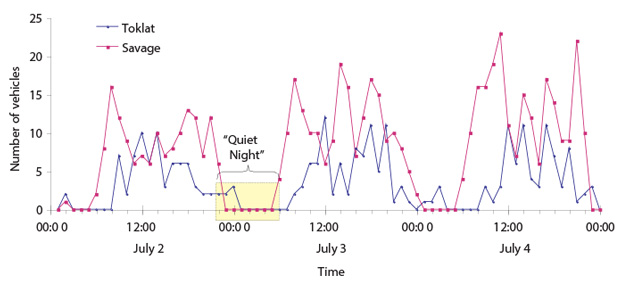
Traffic simulation will be used to model bus driver behavior, traffic interaction with wildlife sightings, and logistics for vehicle operations. Vehicle locations on the park road were automatically uploaded from on-board GPS units by remote base stations throughout the park. Traffic counters monitored the numbers of vehicles along sections of the park road (Figure 3). The results of these studies will be used to develop modeling rules that reflect standards for traffic effects on wildlife, quality of visitor experience, and logistical constraints of the current transportation system. These rules will then be input into a dynamic road capacity model that will integrate the modeling rules and determine whether the Denali Park Road is under-capacity, at-capacity, or over-capacity.

Management Implications
If models suggest that traffic might be increased without negatively affecting park resources or visitor experiences, the park will develop an Environmental Impact Statement to determine alternatives for new traffic patterns and limits. If traffic is increased, the park will implement a Before-After-Control-Impact (BACI) study to assess the impacts of increased traffic on biological, physical, and social indicators. The experimental approach of this study would allow testing of model predictions. This research effort will allow park managers to make informed decisions about managing traffic along the Denali Park Road to protect resources and maintain high quality visitor experiences.
Acknowledgements
We thank our cooperators Robert Manning and Jeff Hallo, University of Vermont; Max Donath, Ted Morris, and John Hourdos, University of Minnesota; Rick Mace, University of Montana; Jim Lawler and John Burch, National Park Service. We also acknowledge the valuable assistance of Amanda Peacock, Jon Paynter, Joe Van Horn, Brad Ebel, Tim Taylor, Phyllis Motsko, Grady Wilson, Joe Durrenburger, Craig Brandt, Jeff Wysong, and Brian Hewitt.
Learn More
This article was written in 2006. Check out current information related to this study on Denali's Road Ecology Program webpage.
Part of a series of articles titled Alaska Park Science - Volume 6 Issue 2: Crossing Boundaries in a Changing Environment.
Last updated: April 21, 2015
