Like nowhere else...
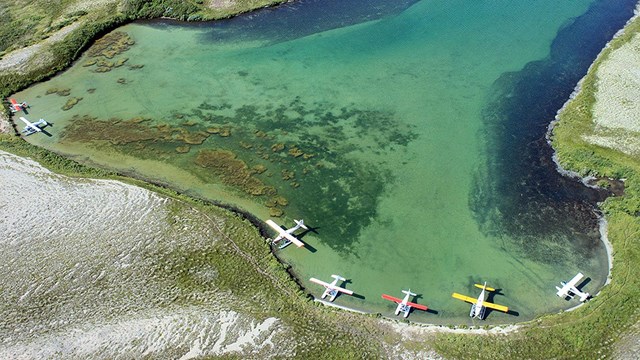
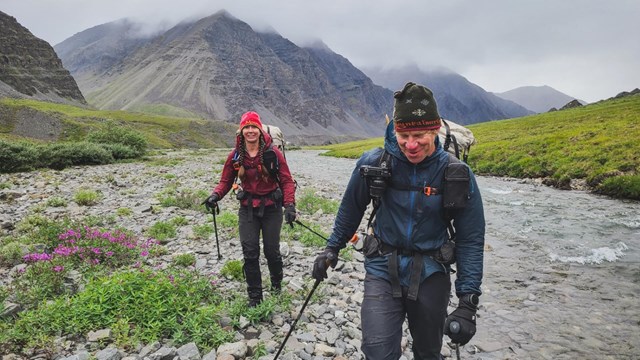
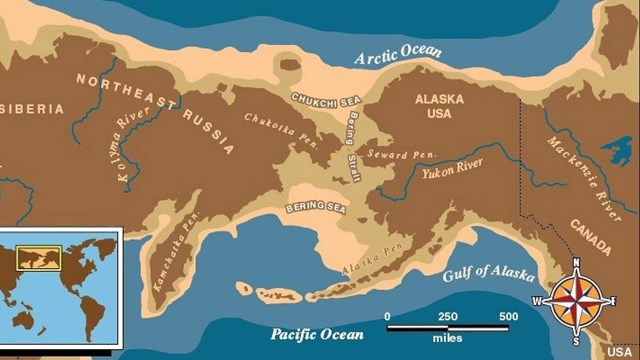
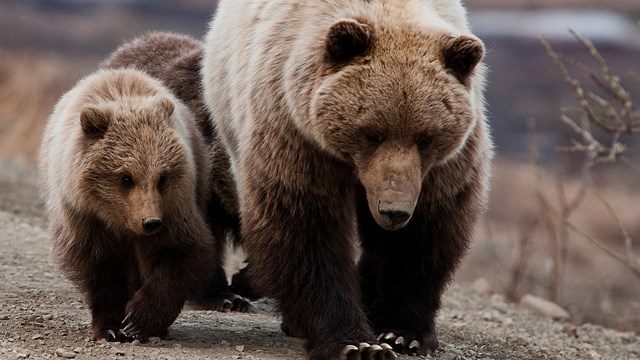
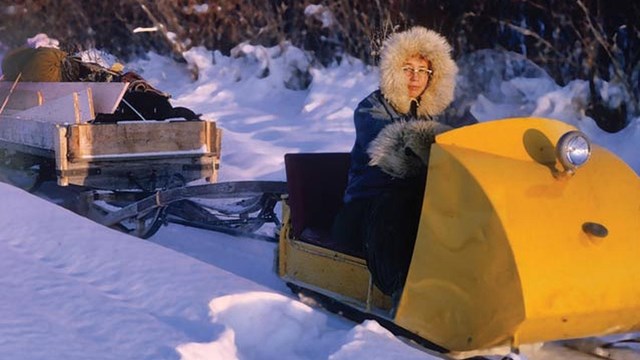
With millions of acres of diverse and vital wilderness and a human history reaching back 14,000 years, the enormity of Alaska’s story is almost incomprehensible. Within this vast landscape, Alaska’s many national parks, preserves, monuments and national historical parks are home to a host of natural, cultural, and historic wonders. Alaska, the Land of the Midnight Sun, has the nation's largest glacial system, world-class wildlife viewing, North America's tallest peak, and so much more.
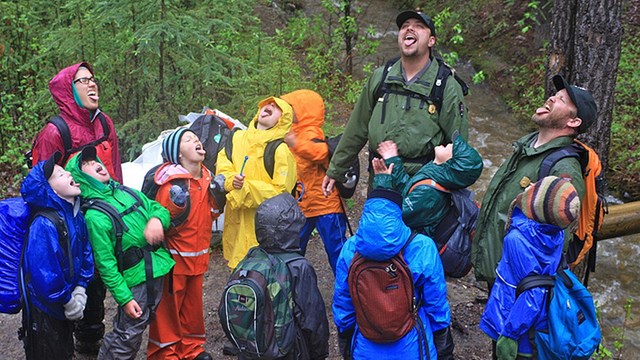
Are you a local looking for information on doing business with the Park Service? A first time visitor to Alaska’s parks? A curious mind looking to learn and explore what the National Park Service in Alaska has to offer? You’ve come to the right place.